Picking the right Azure VM size using Load Testing
Properly configured, the cloud can be very cost effective. When misconfigured, the cloud is very expensive. Recently I helped the company I work for make the move from AWS to Azure. Part of that move was dialing-in the size of the VMs. The major cloud providers, AWS, Azure, Google, and so on have essentially become commodities, especially with IaaS (Infrastructure as a Service). But that doesn't mean every VM configuration is the same across the providers.
How we dialed in the configuration was using a series of load tests after building out the environment. The load tests simulated traffic based on historical data. That data provided the typical traffic seen per day, which included the usual peaks and valleys. In addition to that, the data also showed us the most extreme possible traffic.
Infrastructure Cloud-Based Thinking
In the past, when servers were housed in a data center on premise, they would be configured to handle the largest traffic load plus a certain percent for growth. Back in the day of physical servers, this could be very expensive. Servers were purchased with a configuration in mind in order to handle a load that happened maybe 5% of the time. This was necessary, adding a new physical server could take anywhere from a couple of hours to a couple of days.
Virtualization changed all that, now all that was needed was a large set of servers to handle dozens of large virtual machines. However, depending on the IT department and policies put in place, it could take anywhere from a half hour to a couple of hours to get a virtual machine added. I once worked at a place where we were told it would take a day, at the very least, to get a couple of virtual machines added. Because of this time delay virtual machines were often configured to handle the largest possible traffic load.
Cloud providers have changed all of that. Now it takes a few minutes to spin up a new virtual machine. To add to that speed, it is possible to create scalability sets. A couple of virtual machines are configured as a base, and rules are put in place to automatically add virtual machines when traffic increases.
Now the mindset has shifted from configuring a virtual machine to handle a traffic load which happens only 5% of the time to a traffic load that happens 80% of the time.
Cloud Can Be Expensive
This new functionality comes at a cost. Unlike on-premise virtual machines, All the cloud providers charge per virtual machine. Let's take a look at the Azure cost per virtual machine configuration.
- D1 v2: 1 Core, 3.5 GB of RAM: $104.16 / month
- D2 v2: 2 Cores, 7 GB of RAM: $208.32 / month
- D3 v2: 4 Cores, 14 GB of RAM: $416.64 / month
- D4 v2: 8 Cores, 28 GB of RAM: $833.28 / month
- D5 v2: 16 Cores, 56 GB of RAM: $1499.90 / month
- D11 v2: 2 Cores, 14 GB of RAM: $245.52 / month
- D12 v2: 4 Cores, 28 GB of RAM: $485.09 / month
- D13 v2: 8 Cores, 56 GB of RAM: $872.71 / month
- D14 v2: 16 Cores, 112 GB of RAM: $1570.58 / month
Let's configure a typical ASP.NET Web Farm with a SQL Server Cluster. While discussing the use of Azure App Services or AWS Elastic Beanstalk would be very interesting, for the point of this exercise, we are only using VMs. The smallest setup possible is 2 web servers (the farm) and two SQL Servers (the cluster). My initial gut reaction is to build the farm using 2 web servers with 4 Cores and 14 GB of RAM each with the cluster set to 16 Cores and 112 GB of RAM each (SQL Server likes the RAM).
- D3 v2 (x2): $833.28 / month
- D14 v2 (x2): $3,141.17 / month
Just for the virtual machines, you are looking at $3,974.45 / month or $47,693.40 / year. Wow! I thought cloud was supposed to be cheap, why is it so expensive?
But the real question is, do you need that much horsepower? Could we get by with just 2 cores / 7 GB of RAM per web server and 8 Cores / 56 GB of RAM per SQL Server and scale up when needed?
- D2 v2 (x2): $416.64 / month
- D13 v2 (x2): $1745.42 / month
That works out to $2,162.06 / month or $25,944.72 / year. Much better.
Load Testing using the Scientific Method
The questioning then shifted to: could we run our site using 2 Core / 7 GB for Web and 8 Core / 56 GB for SQL? Well I know we could, but what kind of load could we handle? At what point would we expect the scale set to start scaling? What kind of response time would we get per configuration? Would the response time meet the SLA?
The only way to be able to answer those questions was to run load tests and use the scientific method. The scientific method? That thing you learned about in biology or physics class? Yes, the very same. For those of you unfamiliar with the scientific method or need a refresher:
- Think of interesting questions
- Formulate hypothesis
- Test the hypothesis
- Gather data
- Analyze
- Report
- Repeat
During the testing, I quickly learned a couple of key elements I had forgotten since college and high school.
Change One Element At A Time
In order to get measurable results, it is important to only change one configuration at a time. If at all possible. For example, you don't change both the web server VM size and the SQL Server VM size before a test. You change the web server VM size, test, gather data, analyze, then change the SQL Server VM size.
Establish the data you want to gather and write it down
One of my favorite Mythbusters quotes of all time is "the only difference between screwing around and science is writing it down." For these tests I was interested in the following data elements:
- Response Time (Average, max and mind)
- Web Server CPU Usage
- SQL Server CPU Usage
- Throughput
- Bottlenecks
- Test Start and Stop time
Keep Tests Consistent
It is also important the tests be the same. When the tests change the results change. If you plan on changing the tests then change nothing about the configuration. When starting up I was using a simple JMeter test to hit an endpoint. I used that same test over and over. Once I felt good about the VM configuration I then had the QA person run their load test. I would then analyze the results of their load test and adjust my simple JMeter test to test the next VM configuration.
Failure is an option
Going into a couple of the tests I felt sure I knew the outcome. I expected that once this one particular endpoint was added to our load tests we would see the SQL Server CPU spike. When the endpoint load test was added the SQL Server CPU barely budged. That was unexpected, but a pleasant surprise.
New Relic Usage
By this point, you are probably yelling at the screen, "The title says using New Relic, how did you use New Relic?" Calm down; I am getting to that part.
In the previous section, I established the data I wanted to gather during the tests. NewRelic provided that information through the user interface. Not only that, it keeps a history for at least a couple of weeks, so I can go back to previous load tests and look at the stats to compare.
New Relic was also used to show the business folks (account managers, C-Level executives) all kinds of pretty charts and graphs. It is one thing to say we have less than a 50 ms response time. It is a different ball of wax actually to show it.
What helps build trust in our load tests is the fact New Relic is an independent third-party. They have no bias one way or the other. If the response time of the site is 3 seconds they are going to report 3 seconds. People have biases and there is a temptation to report data using a more optimistic lens.
The Load Tests
I've done a whole lot of talking about the load tests and how they were useful. But that is just talk, I wanted to show how we used them and the kind of data we saw from New Relic. My hope is you can see how we did our testing and either find a flaw in it or think of a way of how you can use load tests in your company. I can guarantee what we did won't work for you exactly. Every company and application is different. My hope is this gets your braining working on some ideas for you and your company.
Initial Load Test
Configuration:
- 2 Web Servers (2 CPUs, 7 GB RAM)
- 1 SQL Server Cluster (8 CPUs, 56 GB RAM)
- 1 Azure WAF (2 medium instances)
- 4000 Simulated Devices
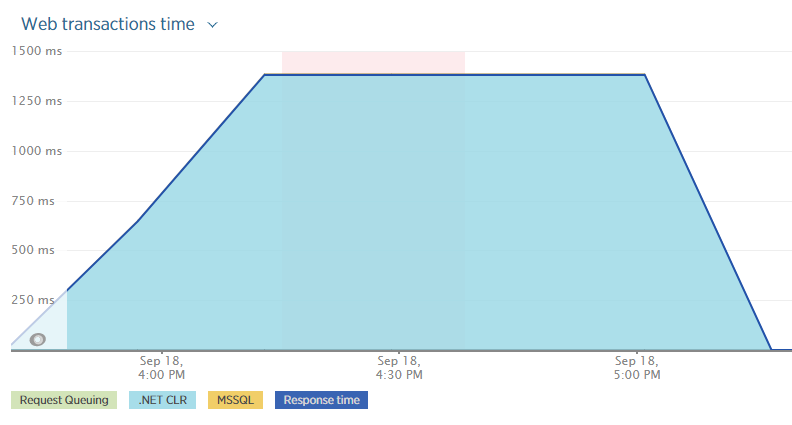
Everyone was very excited when the new environment came online. We thought we had it dialed in perfectly. So we went for broke, 4000 simulated devices hitting the service like a speed freak. This was before we had New Relic installed on the web servers.
Imagine our surprise when the load test returned with an average response time exceeded our expected max of 1.5 seconds per call. Without New Relic, this became very difficult to diagnose. However, in SQL Server I could see several connections blocking one another. Looking into the code, I saw a caching opportunity.
Second Load Test
Configuration:
- 2 Web Servers (2 CPUs, 7 GB RAM)
- 1 SQL Server Cluster (8 CPUs, 56 GB RAM)
- 1 Azure WAF (2 medium instances)
- 500 Simulated Devices
- Caching Enabled
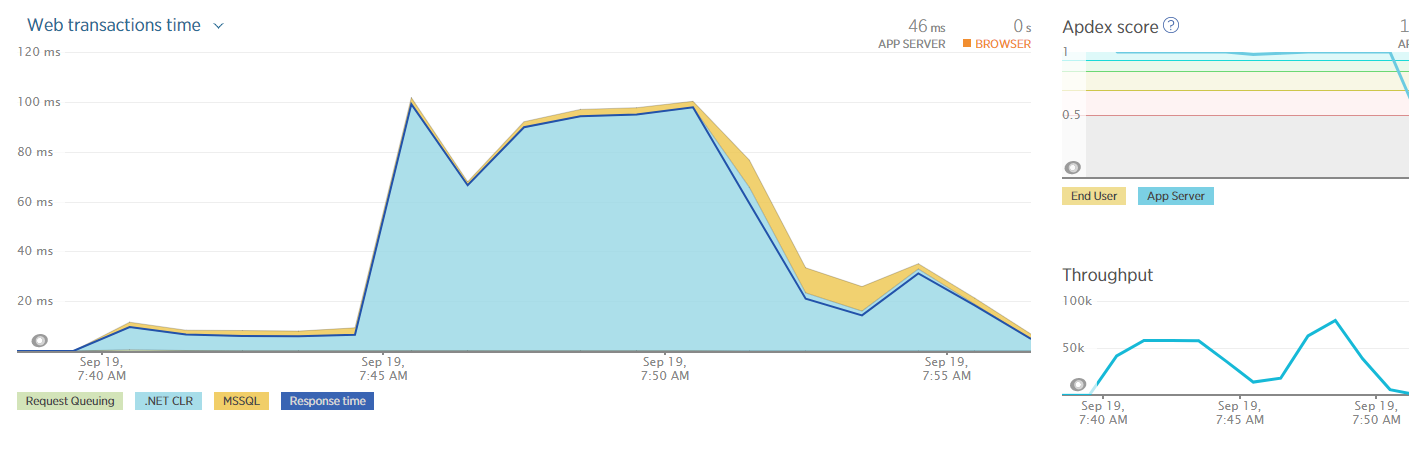
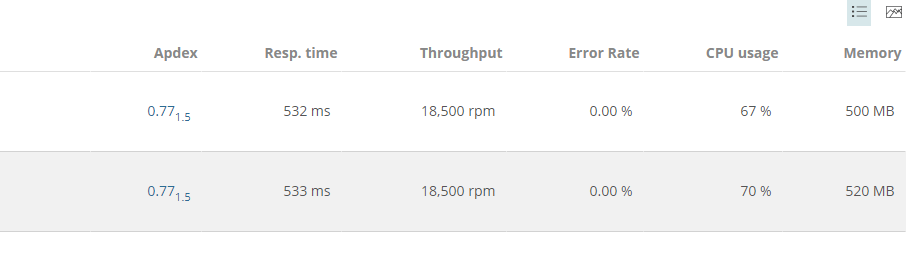
Before kicking off the second load test I installed the New Relic agent. After a couple of quick sanity checks. The load test reported the same results, over 1.5 seconds per call. The requests per minute weren't all that high, perhaps 4500 / minute. This was really baffling considering we dropped the number of simulated devices down to 500. New Relic reported the same results.
Looking at New Relic I noticed something interesting; almost the entire time was spent in the .NET CLR. What the heck?
Clicking one of the top transactions showed the cause, 96% of the time was spent on AcquireRequestState.
![]()
Off to Google I went to dig into this issue earlier. The top result for "New Relic AcquireRequestState" yielded a good answer from New Relic itself
"The AcquireRequestState event is raised after the event handler has been created. This IIS pipeline175 step occurs when ASP.NET acquires the current state (for example, session state) that is associated with the current request."
We are not using Session State for this particular application, towards the bottom of the post it states
"The bottom line is that regardless of the fact that session state is not used in the application, the AcquireRequestState segment is being called. The agent just can't make that sort of thing up. It comes to narrowing down where it's happening."
Okay. Time to start eliminating items from the configuration.
Third Load Test
Configuration:
- Hit 1 Web Server (2 CPUs, 7 GB RAM) directly
- 1 SQL Server Cluster (8 CPUs, 56 GB RAM)
- No Azure WAF
- Single endpoint hit
- Caching Enabled
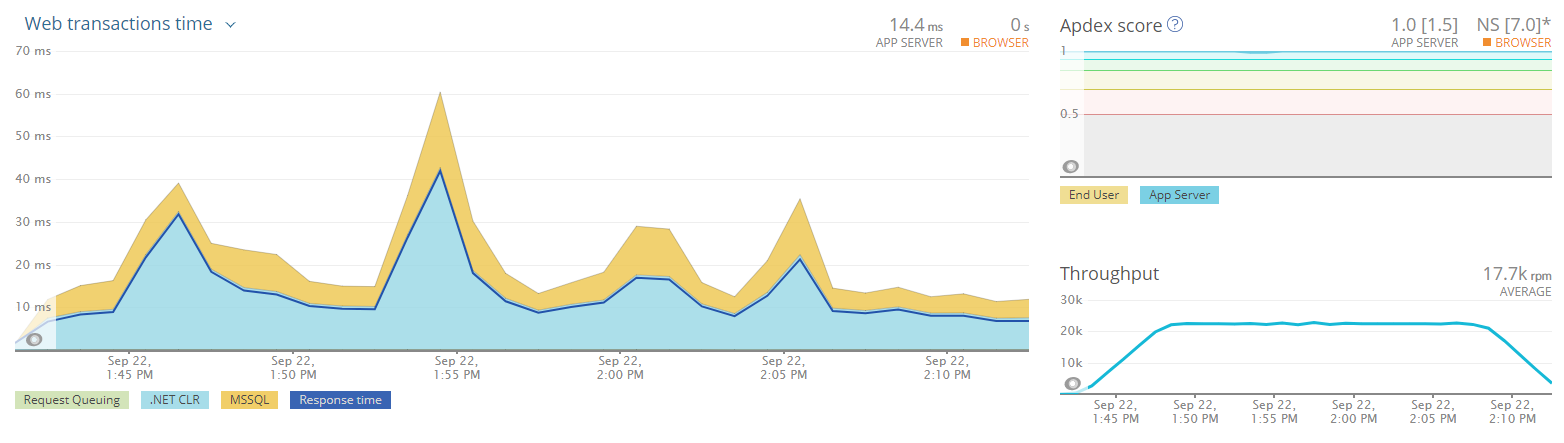
For this test, I hit the web server directly instead of going through the WAF. The response time dropped to less than 100 ms even with the throughput over 50,000 requests per minute.
The only thing I removed from the equation was going through the firewall. Ther
It turns out, yes it was the Azure WAF or Web Application Firewall. Each request that comes into the WAF is compared against the OWASP top 10 vulnerabilities. If it detects a request that is attempting to exploit one of those vulnerabilities it will automatically reject it. It does all this by sending requests in through virtual machines. Azure manages the machines, all you can do is select the size (medium or large) and the number of instances. That is as much detail as was provided. I could only speculate as to what qualifies for "medium." In the test's previous configuration the Azure WAF was set to 2 medium instances. That configuration could not handle the throughput of the load tests.
Turning off the firewall for a load test and hitting the WAF, which essentially became a load balancer at that point, yielded similar results as hitting the web server directly.
Fourth Load Test -> A small series of tests to dial in WAF
Configuration:
- 2 Web Servers (2 CPUs, 7 GB RAM)
- 1 SQL Server Cluster (8 CPUs, 56 GB RAM)
- 1 Azure WAF (variable)
- 500 Simulated Devices
- Caching Enabled
The next series of load tests were spent dialing in the WAF configuration. Azure WAF has two instances sizes, medium and large. It is possible to have anywhere from 2 to 10 instances running. Like everything in the cloud, there is a cost associated with each instance. The goal for this series of load tests was to find the optimal configuration for the WAF to match a reasonable load for the right price. We only wanted to have to touch the WAF when traffic was increasing substantially more than what we predicted.
Fifth Load Test
Configuration:
- 2 Web Servers (2 CPUs, 7 GB RAM)
- 1 SQL Server Cluster (8 CPUs, 56 GB RAM)
- 1 Azure WAF (2 Large)
- 2000 Simulated Devices
- Caching Enabled
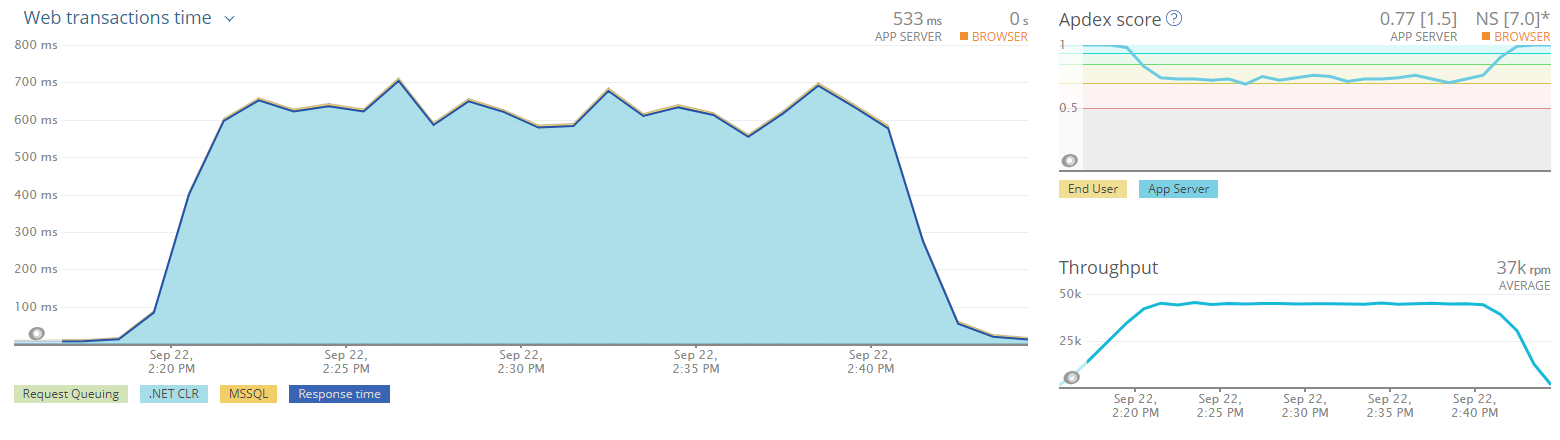
This load test was to test what my boss calls the lake level. It can handle the traffic we expect to have 80-90% of the time. For example, we expect no more than 500 devices connecting using the site on any given day. We want to be able to handle a peak of 4x that amount.
We were very happy to see the results of this load test, the Lake Level configuration could handle at least 4x the expected load.
Sixth Load Test
Configuration:
- 2 Web Servers (2 CPUs, 7 GB RAM)
- 1 SQL Server Cluster (8 CPUs, 56 GB RAM)
- 1 Azure WAF (8 Large)
- 4000 Simulated Devices
- Caching Enabled
This was back to our original extreme test we started at, with 4000 simulated devices. We wanted to make sure even if our estimates were completely off we could handle the load by only increasing the WAF instance count. This way if shit hit the fan we could respond quickly with no down-time.
Another data point we were looking at for the extreme load test was the CPU usage of the web servers as well as the database servers. While I wish I could show you the SQL Server stats, I can't. We don't have New Relic installed and it has been a real pain to pull it out of Azure.
Final Load Test
Configuration:
- 2 Web Servers (2 CPUs, 7 GB RAM)
- 1 SQL Server Cluster (8 CPUs, 56 GB RAM)
- 1 Azure WAF (8 Large)
- 12,000 Simulated Devices
- Caching Enabled
This test was to answer one question only, what could break this configuration. The answer to that was 12,000 devices or 24x our expected day to day load.
This pegged the web server's CPU. Not surprisingly, at this rate, we were pushing through 1.5 million requests an hour, or 36 million per day. Much, much higher than we expect.
Conclusion
The load tests clearly show a smaller configuration than what was originally thought our lake level load. New Relic helped with all of that. Using New Relic we could see, even with the breaking load, memory was not an issue, the CPU was. It would have been much harder to acquire this data without New Relic. It is possible, but what a pain in the ass it would have been.
This is great now we can look at scaling down the VM even further to F2, which is 2 Cores and 4 GB of RAM. The cost per server is only $156.98 / month, which is $313.97 / month for two of them. That works to be $3,767.52 / year for 2 of them. The D2 v2 cost per year for 2 servers is $4,999.68. The CPU is the same as the D2 V2, just the memory is a lot less. And we can save an additional $1,232.16 / year.
Looking at these costs you are probably thinking to yourself, I thought the cloud was cheaper. Looking at the cold hard numbers, this article is talking about spending around $25,000 / year just on virtual machines. Even for the small lake level load. I haven't included the cost of the WAF, SQL Server, Storage, and so on. Here is the dirty secret of the cloud, it is expensive. Even for a simple configuration such as this. There is a reason why Microsoft is spending over a billion dollars per data center and why they are building so many of them. But there is a flip side to that. The data centers are attached directly to the internet backbone. Cloud providers handle purchasing all the physical components to run a data center, racks, switches, power, cooling, cabling, and lest we forget, the servers themselves. Not to mention the people required to maintain all that equipment. All those costs come off the books. Heck, cooling a data center housed on-premise costs a hell of a lot of money. And you have to schedule simulated power outages.
The cloud is expensive. When misconfigured it can be very, very expensive. But all the cloud is doing is showing you how much money you are actually spending on infrasturce and maintenance. It is much more than just the hardware, it is people's time as well. The key to managing that expense is picking the right configuration and a great way to aide in that is to load test.